

Imagine you are cruising down the digital highway in your brand-new virtual car (read: developed website). You’re pretty sure your engine is optimized, and your tires have the perfect air pressure. But suddenly… BAM! You’re pulled over by… the Google Lighthouse traffic officer.
“What did I do wrong?”, you wonder, glancing in the rearview mirror. Well, let’s decipher this ticket together.
Btw before I proceed. I have created an automated test project in webdriverio for demo purposes, but I would advise to read the whole blog to interpret the measurements correctly. https://gitlab.com/learnautomatedtesting/devtoolsperformancereporter
For more information regarding webdriverio(WDIO) please check their website https://webdriver.io/
What is Lighthouse
Lighthouse is an open-source, automated tool developed by Google for improving the quality of web pages. It provides performance metrics and audits for accessibility, progressive web apps, SEO, and more. Users run it against any web page, public or requiring authentication. Lighthouse produces a report with actionable guidance on how to improve the page. It can be accessed via Chrome DevTools, a CLI, or as a Node module. There are so many metrics to validate, I have come to a subset in which I think it can be helpfull for organization to setup tests in cicd icw selenium
1. First Contentful Paint (FCP)
This is when your car (website) shows its first signs of life. In a perfect world, this would be like your car starting up in a nanosecond.
- Green light: 0 - 1000 ms (You’re gone even before the light turns green!)
- Yellow light: 1000 - 3000 ms (Maybe a couple of seconds late, but who’s counting?)
- Red light: >3000 ms (Time for an engine check, my friend!)
2. Largest Contentful Paint (LCP)
This is when the main content of your website is fully visible. If your car were a movie, this would be when the lead actor makes their grand entrance.
- Green light: 0 - 2500 ms
- Yellow light: 2500 - 4000 ms
- Red light: >4000 ms

3. Interactive
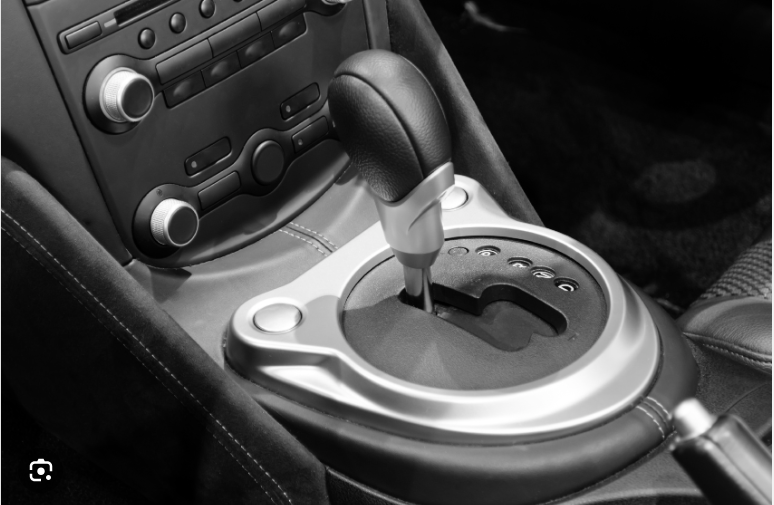
The moment your website becomes fully interactive. Similar to when your car can shift through all gears smoothly.
- Green light: 0 - 3800 ms
- Yellow light: 3800 - 7300 ms
- Red light: >7300 ms
4. Cumulative Layout Shift (CLS)
Nobody likes a car that swerves unexpectedly left or right. This gauges the visual stability of your site.
- Green light: 0 - 0.1
- Yellow light: 0.1 - 0.25
- Red light: >0.25
5. maxPotentialFID (First Input Delay)
How quickly does your site respond to the user’s first interaction? It’s like your car responding the moment you touch the accelerator.
- Green light: 0 - 100 ms
- Yellow light: 100 - 300 ms
- Red light: >300 ms

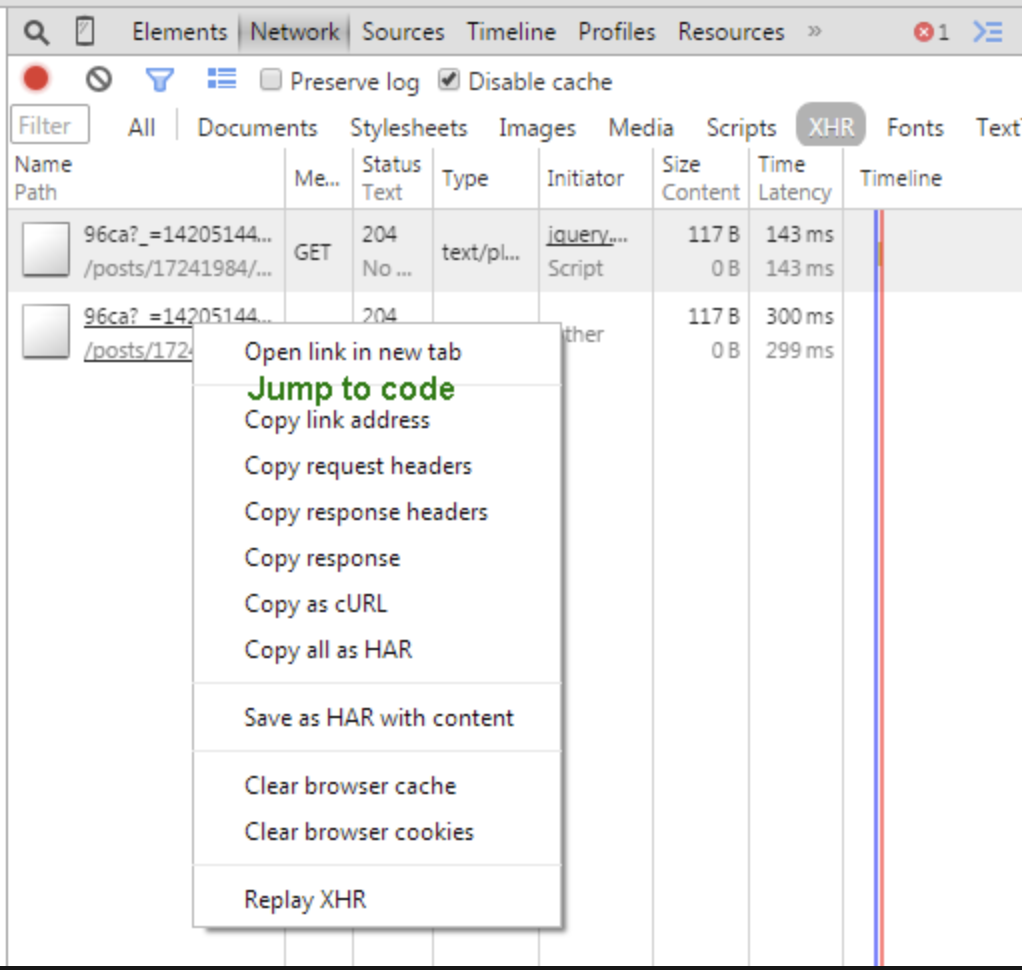
Integrating XHR with lighthouse measurements
XHR stands for XMLHttpRequest. It’s a web API available in web browsers that allows web pages to make asynchronous requests to servers without having to reload the page. This capability has been a fundamental part of creating dynamic, responsive web applications.
Why Measure XHR Performance?
User Experience: Slow responses can lead to a frustrating user experience. If a user has to wait a long time for feedback after an action (like clicking a button), they may think the site is broken or unreliable. Measuring XHR performance helps identify bottlenecks that can hinder user interaction.
Efficiency of Data Exchange: Some XHRs can retrieve or send large amounts of data. Monitoring these can help identify if too much data is being exchanged or if optimization is needed to reduce the payload.
Dependency on External Services: Many modern applications rely on APIs and services. If one of these external services is slow or down, it can impact the application’s performance. By monitoring XHRs, developers can identify issues with third-party services.
Optimizing Server Performance: If specific XHR requests consistently take a long time, it may indicate server-side issues, such as database query inefficiencies or server configuration problems.
Now that we know this a bit how can we measure all of this in combination with CI/CD and testautomation, to get a constant check of your car and the interexchange of validating if the bumby road(XHR) is still driving smootly
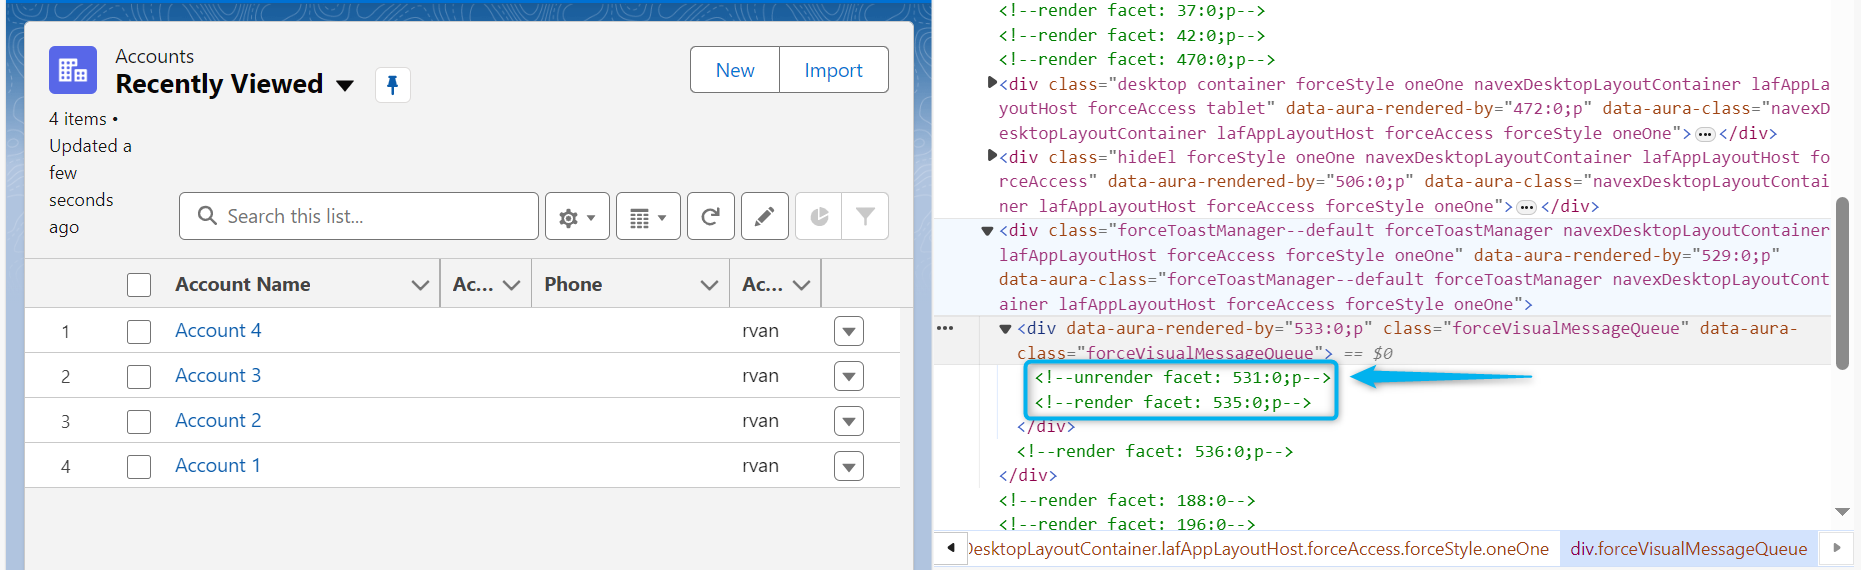
Lets dive into the orangehrmlive example https://opensource-demo.orangehrmlive.com to see via code how this can be done. First of all I am using webdriverio. I love wdio, it is for me the best framework in terms of supporting reliable UI automated tests in combination with selenium and devtools. But of course feel free to implement the same in java, .net, python
For the techies: what do you need!
This code is about testing the performance of a web application while interacting with it. It uses WebDriverIO to interact with the browser and test the “login” process. Throughout the testing, it captures and records how long certain actions (like XHRs - which are basically web requests) take, and also fetches some other metrics related to the performance.
The most important function is: captureAndAggregatePerformanceData
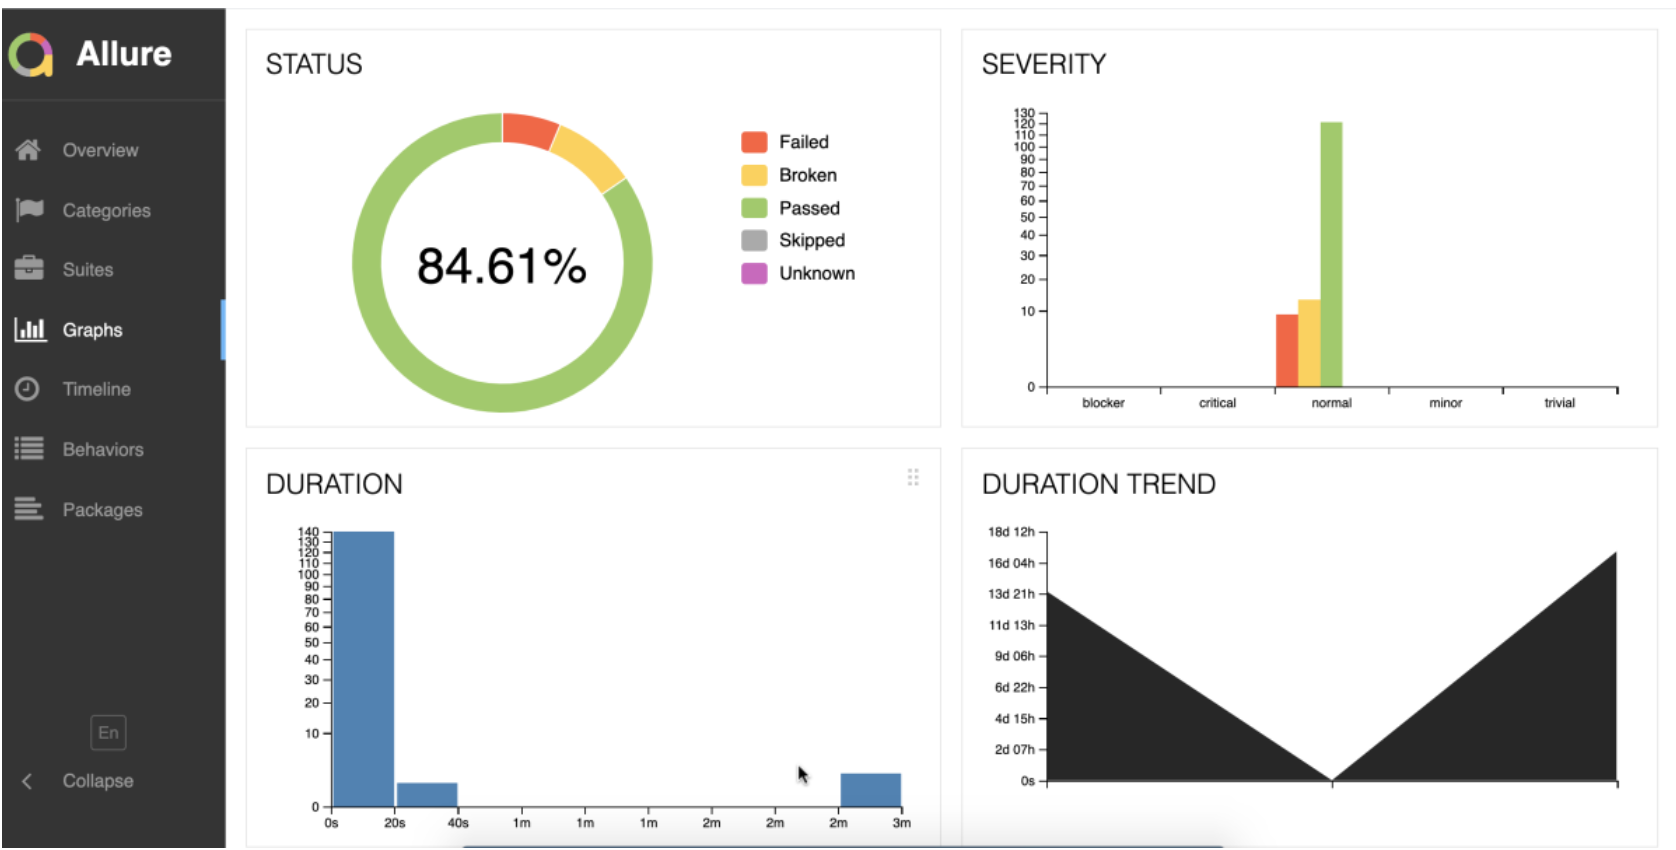
It captures various performance metrics from the currently loaded web page and structures them. Steps include:
Capturing a screenshot. Fetching navigation timings like when the content loaded and total time for the web page to load. Fetching other metrics related to performance. Structuring this data to be saved.
Please check my gitlab project to use this for your own purposes. The details will be explained there thouroughly and else feel free to ask
https://gitlab.com/learnautomatedtesting/devtoolsperformancereporter
If you find yourself with a lot of “red lights,” fear not! Remember, every road (or website) has its bumps. With the right tools and a dash of know-how, you’ll be back on the path to green lights and smooth cruising on the digital highway.