
Harnessing Test Automation for Market Insights for profits
By automating the analysis of market trends, liquidity levels, and candlestick patterns, traders can now access real-time data-driven insights with unprecedented accuracy and efficiency. This innovative approach not only enhances the decision-making process but also opens up new horizons for optimizing trading strategies in the volatile crypto market. Let’s dive into how test automation can help the way we understand and interact with the financial landscape, providing a competitive edge in the pursuit of profitability.
Identifying Chart Trends: Test automation tools can be programmed to scrape trading platforms and financial websites to collect data on specific cryptocurrencies. By analyzing historical price movements and volume changes, these tools can help identify potential trends, such as bullish or bearish patterns, that might not be immediately obvious. This trend analysis can be crucial for timing the market, deciding when to enter or exit trades.
import requests
import pandas as pd

# Fetch historical Bitcoin data
url = "https://api.coingecko.com/api/v3/coins/bitcoin/market_chart"
params = {
    'vs_currency': 'usd',
    'days': '30',  # Last 30 days
}
response = requests.get(url, params=params)
data = response.json()

# Convert prices to a DataFrame
df = pd.DataFrame(data['prices'], columns=['Timestamp', 'Price'])
df['Date'] = pd.to_datetime(df['Timestamp'], unit='ms')

print(df.head())

# Further analysis and plotting can be performed on df
When It comes to trading it is important to identify trends based on different time charts, weekly daily, you can e.g. set indicators in an excel sheet in the end to identify bullish or bearish trends for those different time charts to make proper decisions
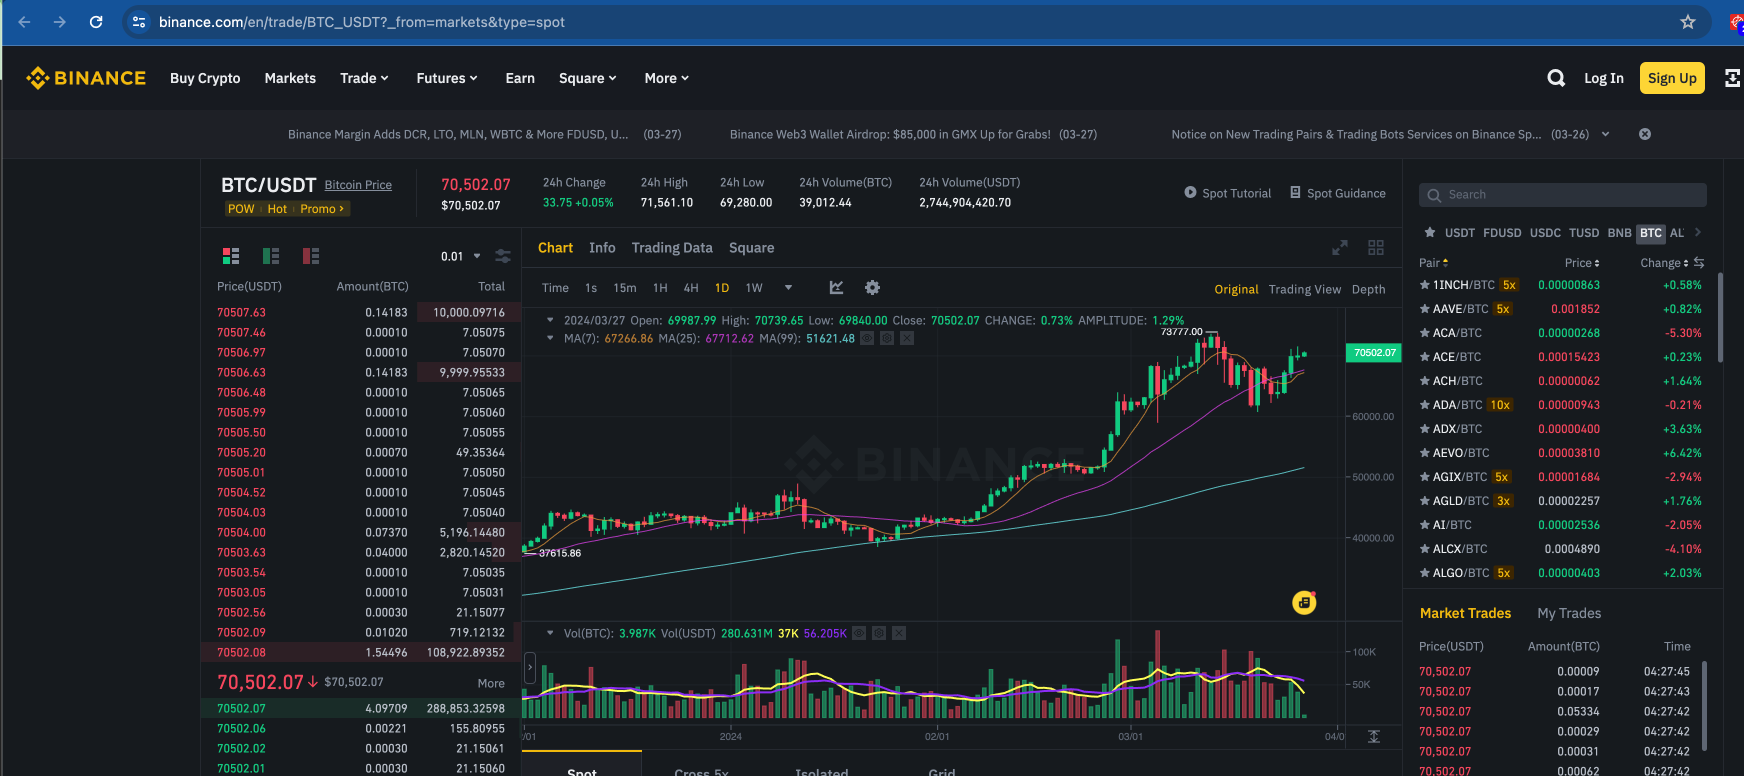
Checking Liquidity Levels: Liquidity is a vital factor in trading, affecting the ease with which assets can be bought or sold in the market without causing significant price changes. Automated scripts can monitor and report liquidity levels across different exchanges in real-time, providing traders with up-to-date information to choose the most favorable trading venues or to gauge market stability. Especially big market makers love to short squeeze retailers. 🙂
from selenium import webdriver
from selenium.webdriver.common.by import By
from selenium.webdriver.common.keys import Keys
import time

# Replace this URL with the actual trading page URL of the exchange
exchange_url =

"https://www.binance.com/en/trade/BTC_USDT?_from=markets&type=spot"

# Setup WebDriver (assuming Chrome)
driver = webdriver.Chrome()

# Navigate to the Bitcoin trading page
driver.get(exchange_url)

# Give the page some time to load
time.sleep(5)

# Example: Fetching the 24h trading volume as a liquidity indicator
# Note: The element identifier ('element_id_for_volume') will vary and needs to be updated
volume_element = driver.find_element(By.ID, 'element_id_for_volume')
btc_volume = volume_element.text

print(f"24h Trading Volume for Bitcoin: {btc_volume}")

# Cleanup
driver.quit()
Advising on Candlestick Patterns: Candlestick patterns are a cornerstone of technical analysis in trading, offering insights into market sentiment and potential price movements. By automating the detection of specific patterns, such as ‘Doji’, ‘Hammer’, or ‘Shooting Star’, traders can receive timely advice on whether to set up a trade. This automation can be particularly useful in cryptocurrency markets, where rapid price changes demand swift decision-making.
In tradingview I helped a trading expert with setting up an bullish engulving pattern, but can easily do this also with your own scraped data in python.
import pandas as pd
import matplotlib.pyplot as plt
import matplotlib.dates as mdates

# Load historical price data
df = pd.read_csv('price_data.csv', parse_dates=['Date'])
df.set_index('Date', inplace=True)

# Define the Bullish Engulfing pattern
def is_bullish_engulfing(row, prev_row):
    return (prev_row['Close'] < prev_row['Open']) and \
           (row['Close'] > row['Open']) and \
           (row['Open'] < prev_row['Close']) and \
           (row['Close'] > prev_row['Open'])

# Identify Bullish Engulfing patterns
df['Bullish Engulfing'] = False
for i in range(1, len(df)):
    df.at[df.index[i], 'Bullish Engulfing'] = is_bullish_engulfing(df.iloc[i], df.iloc[i-1])

# Filter dates with Bullish Engulfing pattern
bullish_dates = df[df['Bullish Engulfing']].index

# Plotting
plt.figure(figsize=(12, 6))
plt.plot(df.index, df['Close'], label='Close Price')
plt.scatter(bullish_dates, df.loc[bullish_dates]['Close'], color='red', label='Bullish Engulfing', marker='^')

# Formatting
plt.title('Bullish Engulfing Candlestick Pattern')
plt.xlabel('Date')
plt.ylabel('Price')
plt.legend()
plt.gca().xaxis.set_major_locator(mdates.MonthLocator())  # Show one tick per month
plt.gca().xaxis.set_major_formatter(mdates.DateFormatter('%Y-%m'))  # Format tick labels
plt.xticks(rotation=45)
plt.tight_layout()
plt.show()
Overall the most important thing as with everything is first understanding why you are doing it, and therefor you need a proper trading strategy
Implementing an Automated Web Scraping Strategy
To set up test automation for web and api scraping and market analysis, follow these steps:
Select the Right Tools: Choose test automation tools that support web scraping functionalities. Selenium WebDriver, for instance, is a popular choice for automating web browsers and can be used for scraping purposes. Nowadays you can setup those things easily in serverless cloud, lambdas
Define Your Data Points: Clearly identify which data points are crucial for your trading strategy, such as specific chart indicators, liquidity levels of assets, or particular candlestick patterns.
Develop the Automation Scripts: Write scripts that navigate to your data sources, extract the necessary information, and perform the required analysis. This might involve parsing HTML to retrieve price data or using APIs provided by trading platforms.
Analyze and Act: Use the collected data to perform further analysis, such as calculating moving averages or identifying support and resistance levels. Automate the generation of reports or alerts based on predefined criteria to inform your trading decisions.
Iterate and Optimize: Continuously refine your scripts based on performance and adapt your strategy as market conditions change. The flexibility of test automation allows for rapid adjustments and optimizations.
Using Testautomation to give my hobby cryptotrading a boost.
Test automation gave me an edge as a hobbiest for strategic market analysis, and I believe that professional traders can gain a significant edge in the cryptocurrency markets. Automated web scraping for trend identification, liquidity checks, and candlestick pattern analysis not only saves time but also provides a level of depth and consistency in analysis that manual processes cannot match. With these insights, traders can make more informed decisions, responding quickly to market opportunities with a solid foundation of data-driven advice. Special thanks to Cryptocache and whatsnext to provide me the insights using predictive analytics for trading